Cite report
IEA (2024), Global Methane Tracker 2024, IEA, Paris https://www.iea.org/reports/global-methane-tracker-2024, Licence: CC BY 4.0
Understanding methane emissions
Atmospheric concentrations of methane continue to rise
The concentration of methane in the atmosphere is now over two-and-a-half times greater than pre-industrial levels. The increase has accelerated in recent years, and preliminary data indicates that there was another significant annual increase in 2023.
Changes in atmospheric methane concentrations, 1990-2023
OpenTwo key characteristics determine the impact of different greenhouse gases on the climate: the length of time they remain in the atmosphere and their ability to absorb energy. Methane has a much shorter atmospheric lifetime than carbon dioxide (CO2) – around 12 years compared with centuries – but absorbs much more energy while it exists in the atmosphere.
There are various ways to combine these factors to estimate the effect on global warming and express a tonne of a methane in CO2 equivalent terms (CO2-eq). The most common is the global warming potential (GWP), although different conversion factors can be applied. Some consider the impact of methane over a 20-year timeframe (GWP20), with one tonne of methane equivalent to 82-87 tonnes of CO2. Others look at its impact over a 100-year timeframe (GWP100), with one tonne of methane equivalent to around 30 tonnes of CO2. Alternative metrics, such as the Global Temperature Potential, can be used to more closely link methane emissions to the temperature increase expected in a future year. In this work, we consider one tonne of methane to be equivalent to 30 tonnes of CO2-eq.
Regardless of the conversion factor, methane is a very potent greenhouse gas, and rapid and sustained cuts in emissions from the energy sector are imperative to limit global warming to 1.5 °C. Methane also affects air quality because it can lead to ground level (tropospheric) ozone, a dangerous pollutant. Methane leaks can also pose explosion and health hazards.
The energy sector is the second largest source of methane emissions from human activity
The most recent comprehensive assessment – provided in the Global Methane Budget – suggests that annual global methane emissions are around 580 Mt. This includes emissions from natural sources (around 40% of the total) and from human activity (around 60% of the total).
Sources of methane emissions, 2023
OpenThe energy sector was responsible for nearly 130 Mt of methane emissions in 2023 – more than one third of the total amount attributable to human activity and second only to agriculture (around 145 Mt in 2017). Emissions from fossil fuel operations can occur throughout the supply chain. Oil operations are responsible for around 50 Mt of methane emissions and just under 30 Mt is emitted from the natural gas supply chain. An additional 1 Mt leaks from end-use equipment. Coal accounts for another 40 Mt, mostly from underground mines (25 Mt). A further 10 Mt comes from the incomplete combustion of bioenergy, largely from the traditional use of biomass.
The incomplete combustion of gas in flares is a leading cause of methane emissions
Flaring is a wasteful practice that causes emissions of CO2, methane and black soot, and is damaging to health. There should be minimal methane emissions if a flare is designed, maintained and operated correctly, but that is not always the case, and higher emissions can occur as a result of factors such as weather and changes in production rates. Occasionally, an active flare may be totally extinguished, resulting in the direct venting of methane gas to the atmosphere that should be combusted.
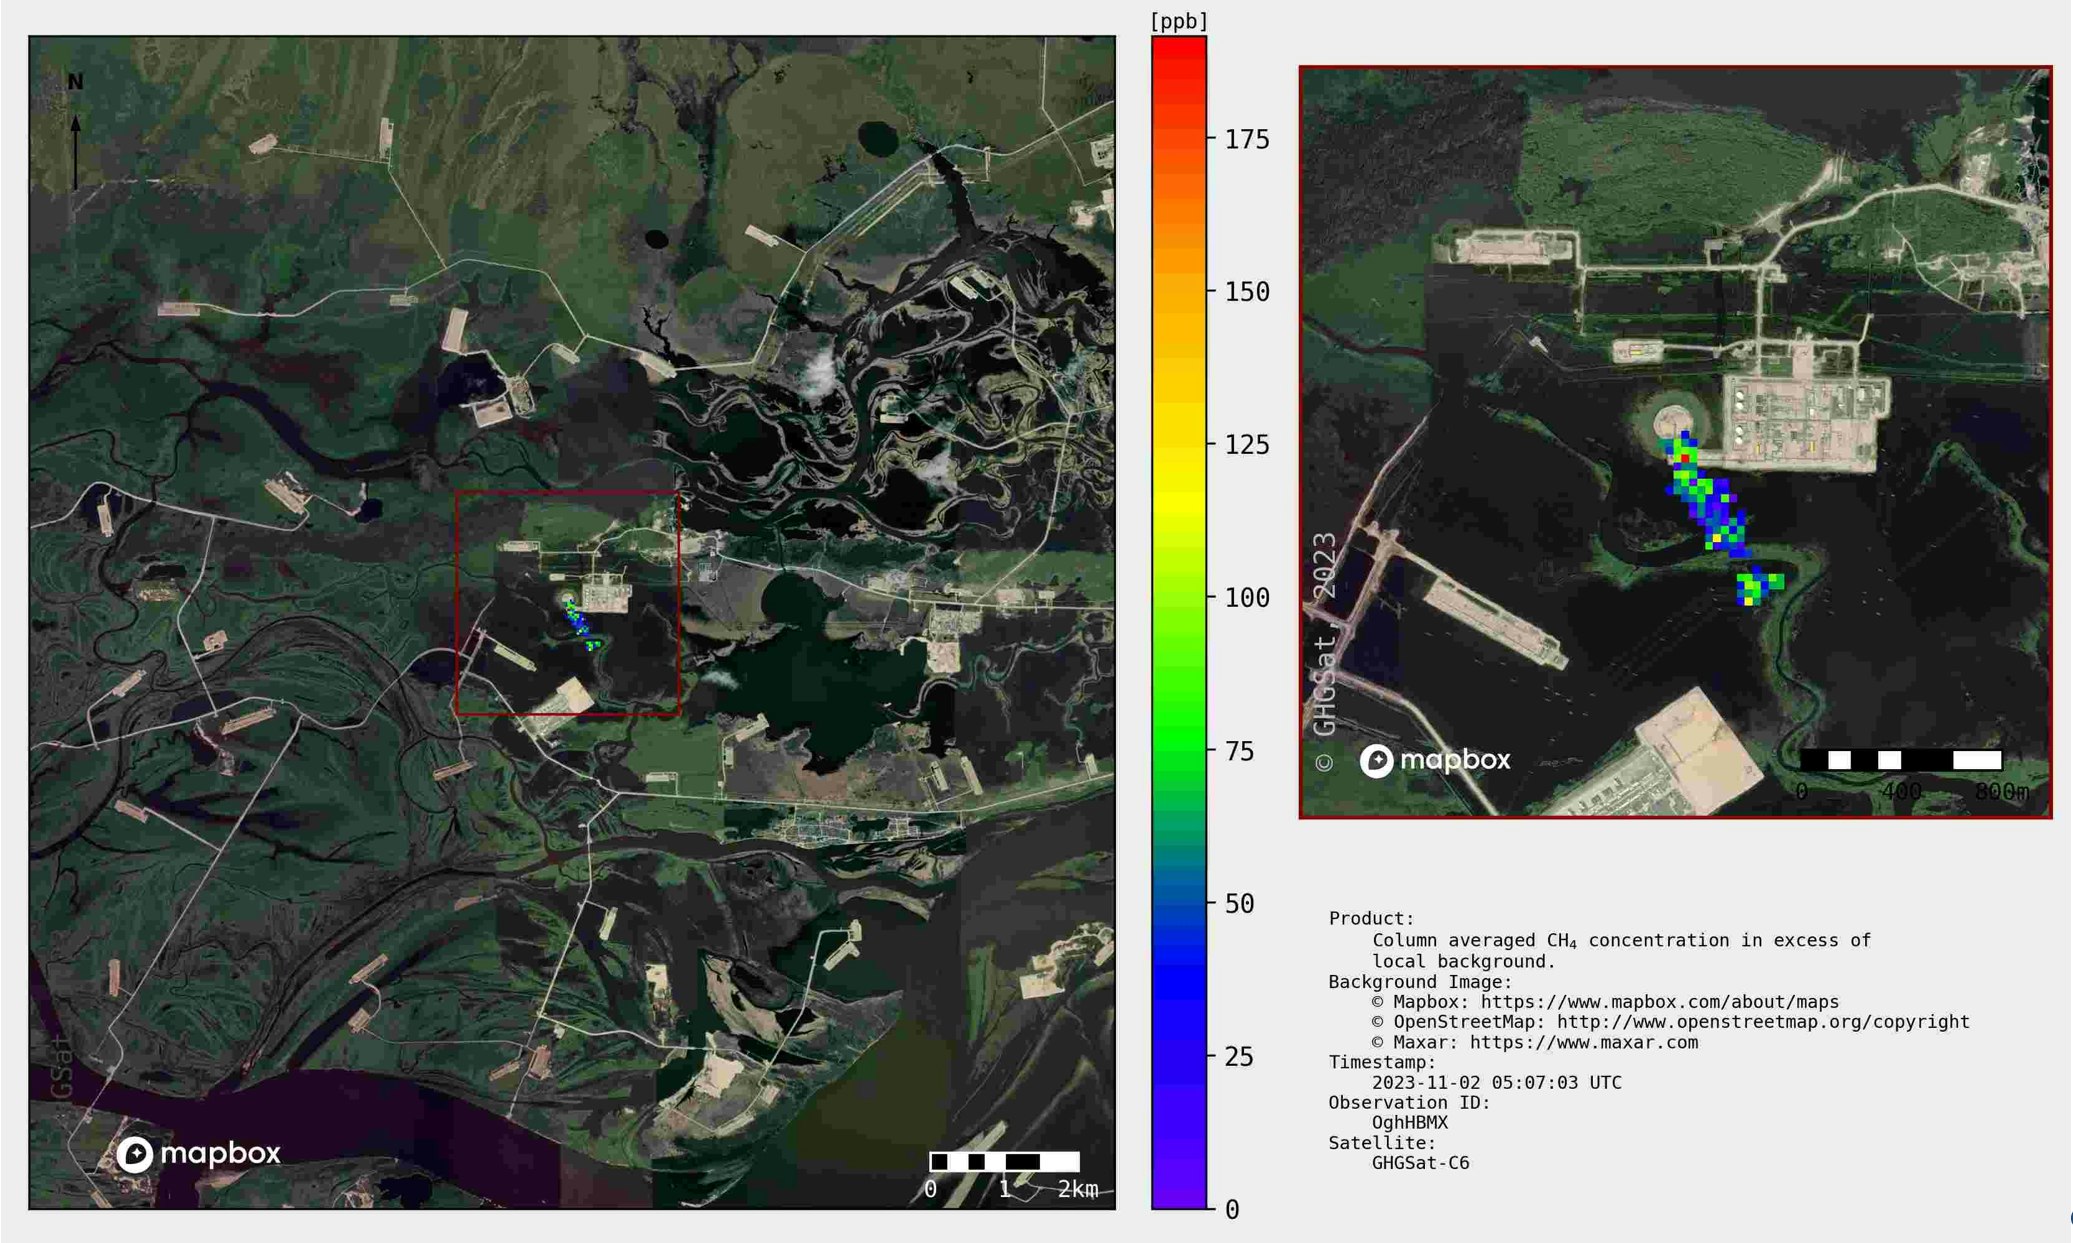
Satellite-detected methane emissions from an unlit flare in Siberia, 2023
Open
We estimate that flares have a global average combustion efficiency of around 92%. This is based on a detailed bottom-up assessment of production types; facility and flare design practices; operators; changes in produced volumes over field lifetime; local crosswind variability; and the strength of regulation, oversight and enforcement in flaring sites around the world. Our estimate of flaring efficiency is significantly lower than the general assumption of 98%. We estimate that flaring therefore results in nearly 500 Mt of CO2‑eq annual greenhouse gas (GHG) emissions, and that the incomplete combustion of gas from flares causes around 10% of methane emissions from oil and gas operations.
How the IEA Global Methane Tracker is built
The IEA produces and publishes country-level estimates for energy-related methane emissions and abatement options as part of our IEA Global Methane Tracker. This data tool also includes the latest emissions estimates from non-energy sectors – waste and agriculture – based on publicly-available data sources to provide a fuller picture of methane sources from human activity. Analysis of how different policy options could reduce methane emissions is also available, as well as comparisons of commitments and plans to reduce methane emissions across countries and regions.
The IEA works closely with UNEP’s International Methane Emissions Observatory (IMEO) and other partners to ensure estimates reflect the latest findings from measurement-based, peer-reviewed studies. A number of studies released in 2023 use satellite data and inversion approaches, for example, by reconciling top-down and bottom-up inventories and observations, comparing TROPOMI data and field campaigns, assessing emissions from coal mines in China, and creating global methane flux estimates from extensive satellite concentration data. Other studies use data collected from planes to understand emissions from specific regions, including offshore production facilities in the North Sea. Data from all public satellites, the location of measurement studies, and notifications from IMEO’s Methane Alert and Response System are available in an online data portal. There are fewer studies currently available that provide measurement data for LNG supply and biofuel production. And there are few recent studies estimating methane emissions from bioenergy – especially emissions related to the traditional use of biomass in cookstoves – and there exists significant uncertainty in these estimates.
Similarly, the IEA’s Global Methane Tracker includes emissions from the end use of coal, oil products and natural gas. These estimates are based on emissions factors published by the Intergovernmental Panel on Climate Change (IPCC). Some measurement campaigns have suggested that these emissions factors could significantly underestimate actual emissions across different end-use environments, including in industry, cities and households. These are areas with very high levels of uncertainty, and our estimates will continue to be updated as the evidence base grows.
For solid bioenergy, emissions estimates in the Global Methane Tracker rely on emission factors reported by the IPCC in 2006. There is some debate surrounding these factors, as other publications indicate that traditional use of solid bioenergy in cooking and other residential applications in emerging market and developing economies is significantly higher.
Emissions from abandoned coal mines and oil and gas wells present another area of uncertainty. There is limited information available on the number of abandoned wells, mines and related infrastructure. There is also a lack of field campaigns and satellite data observation and processing for such sites. While the number of studies is increasing, we do not yet include these potential emissions sources in the Global Methane Tracker. These sources could, nonetheless, represent significant levels of emissions. For example, passive leakage from abandoned wells in western Canada alone could result in 90 000 tonnes of methane per year. Emissions from plugged and unplugged abandoned oil and gas wells could lead to up to 2.6 Mt of methane annually in the United States. Emissions from abandoned coal mines could also represent a significant share of methane emissions from coal mines globally. A recent study in China shows unabated abandoned coal mines could emit 4.7 Mt of methane annually.
This report and the information presented in the Methane Tracker Data Explorer is our best attempt to reconcile existing information and produce a consistent set of country-level emissions and abatement estimates. Further details on the methods used can be found in the Global Methane Tracker Documentation. We recognise these estimates do not represent the last word and welcome any feedback based on measurement campaigns and robust data sources that can further refine our estimates. Relevant reports, scientific studies or information can be shared with IEA analysts by email at MethaneTracker@iea.org.