Cite report
IEA (2024), Renewables 2023, IEA, Paris https://www.iea.org/reports/renewables-2023, Licence: CC BY 4.0
Report options
Electricity
Global forecast summary
2023 marks a step change for renewable power growth over the next five years
Renewable electricity capacity additions reached an estimated 507 GW in 2023, almost 50% higher than in 2022, with continuous policy support in more than 130 countries spurring a significant change in the global growth trend. This worldwide acceleration in 2023 was driven mainly by year-on-year expansion in the People’s Republic of China’s (hereafter “China”) booming market for solar PV (+116%) and wind (+66%). Renewable power capacity additions will continue to increase in the next five years, with solar PV and wind accounting for a record 96% of it because their generation costs are lower than for both fossil and non-fossil alternatives in most countries and policies continue to support them.
Renewable electricity capacity additions by technology and segment, 2016-2028
OpenSolar PV and wind additions are forecast to more than double by 2028 compared with 2022, continuously breaking records over the forecast period to reach almost 710 GW. At the same time, hydropower and bioenergy capacity additions will be lower than during the last five years as development in emerging economies decelerates, especially in China.
China is in the driver’s seat
China’s renewable electricity capacity growth triples in the next five years compared with the previous five, with the country accounting for an unprecedented 56% of global expansion. Over 2023-2028, China will deploy almost four times more renewable capacity than the European Union and five times more than the United States, which will remain the second- and third-largest growth markets. The Chinese government’s Net Zero by 2060 target, supported by incentives under the 14th Five-Year Plan (2021-2025) and the ample availability of locally manufactured equipment and low-cost financing, stimulate the country’s renewable power expansion over the forecast period.
Meanwhile, expansion accelerates in the United States and the European Union thanks to the US Inflation Reduction Act (IRA) and country-level policy incentives supporting EU decarbonisation and energy security targets. In India, progressive policy improvements to remedy auction participation, financing and distributed solar PV challenges pay off with faster renewable power growth through 2028. In Latin America, higher retail prices spur distributed solar PV system buildouts, and supportive policies for utility-scale installations in Brazil boost renewable energy growth to new highs.
Renewable energy expansion also accelerates in the Middle East and North Africa, owing mostly to policy incentives that take advantage of the cost-competitiveness of solar PV and onshore wind power. Although renewable capacity increases more quickly in sub-Saharan Africa, the region still underperforms considering its resource potential and electrification needs
The forecast has been revised upwards, but country and technology trends vary
We have revised the global Renewables 2023 forecast up by 33% (or 728 GW) from our December 2022 publication. For most countries and regions, this revision reflects policy changes and improved economics for large-scale wind and solar PV projects, but also faster consumer adoption of distributed PV systems in response to higher electricity prices. Overall, China accounts for the most significant upward revisions for all technologies except bioenergy for power, for which reduced government support, feedstock limitations and complicated logistics remain challenging.
Despite regulatory changes to its net metering scheme, Brazil’s distributed PV capacity growth is exceeding our expectations, leading to noticeable upward revisions. For other countries, a more optimistic outlook result from policy improvements for auction design and permitting, and a growing corporate PPA market in Germany; positive impacts of IRA incentives in the United States; and speedier streamlined renewable energy auctioning in India.
Conversely, we have revised down the forecast for Korea because the government’s policy focus has shifted from renewables to nuclear energy, reducing solar PV targets. We have also reined in forecast growth for other markets compared with last year’s outlook: for Spain because renewable energy auctions have been significantly undersubscribed; for Australia due to continued policy uncertainty following early achievement of its Large-scale Renewable Energy Target (LRET); for Oman because development time frames for large-scale renewable energy projects have been longer than expected, including for green hydrogen; and for multiple Association of Southeast Asian Nations (ASEAN) countries as a result of sustained policy uncertainty as well as overall power supply gluts limiting additional renewable deployment in the short term.
Rapid government responses to grid connection, permitting, policy and financing challenges can accelerate renewable energy growth
In the main case, taking country-specific challenges that hamper faster renewable energy expansion into account, we forecast that almost 3 700 GW of new renewable capacity will become operational worldwide over the next five years. In contrast, in our accelerated case, we assume that governments overcome these challenges and implement existing policies more quickly.
Renewable electricity capacity by primary driver, 2023-2028
Open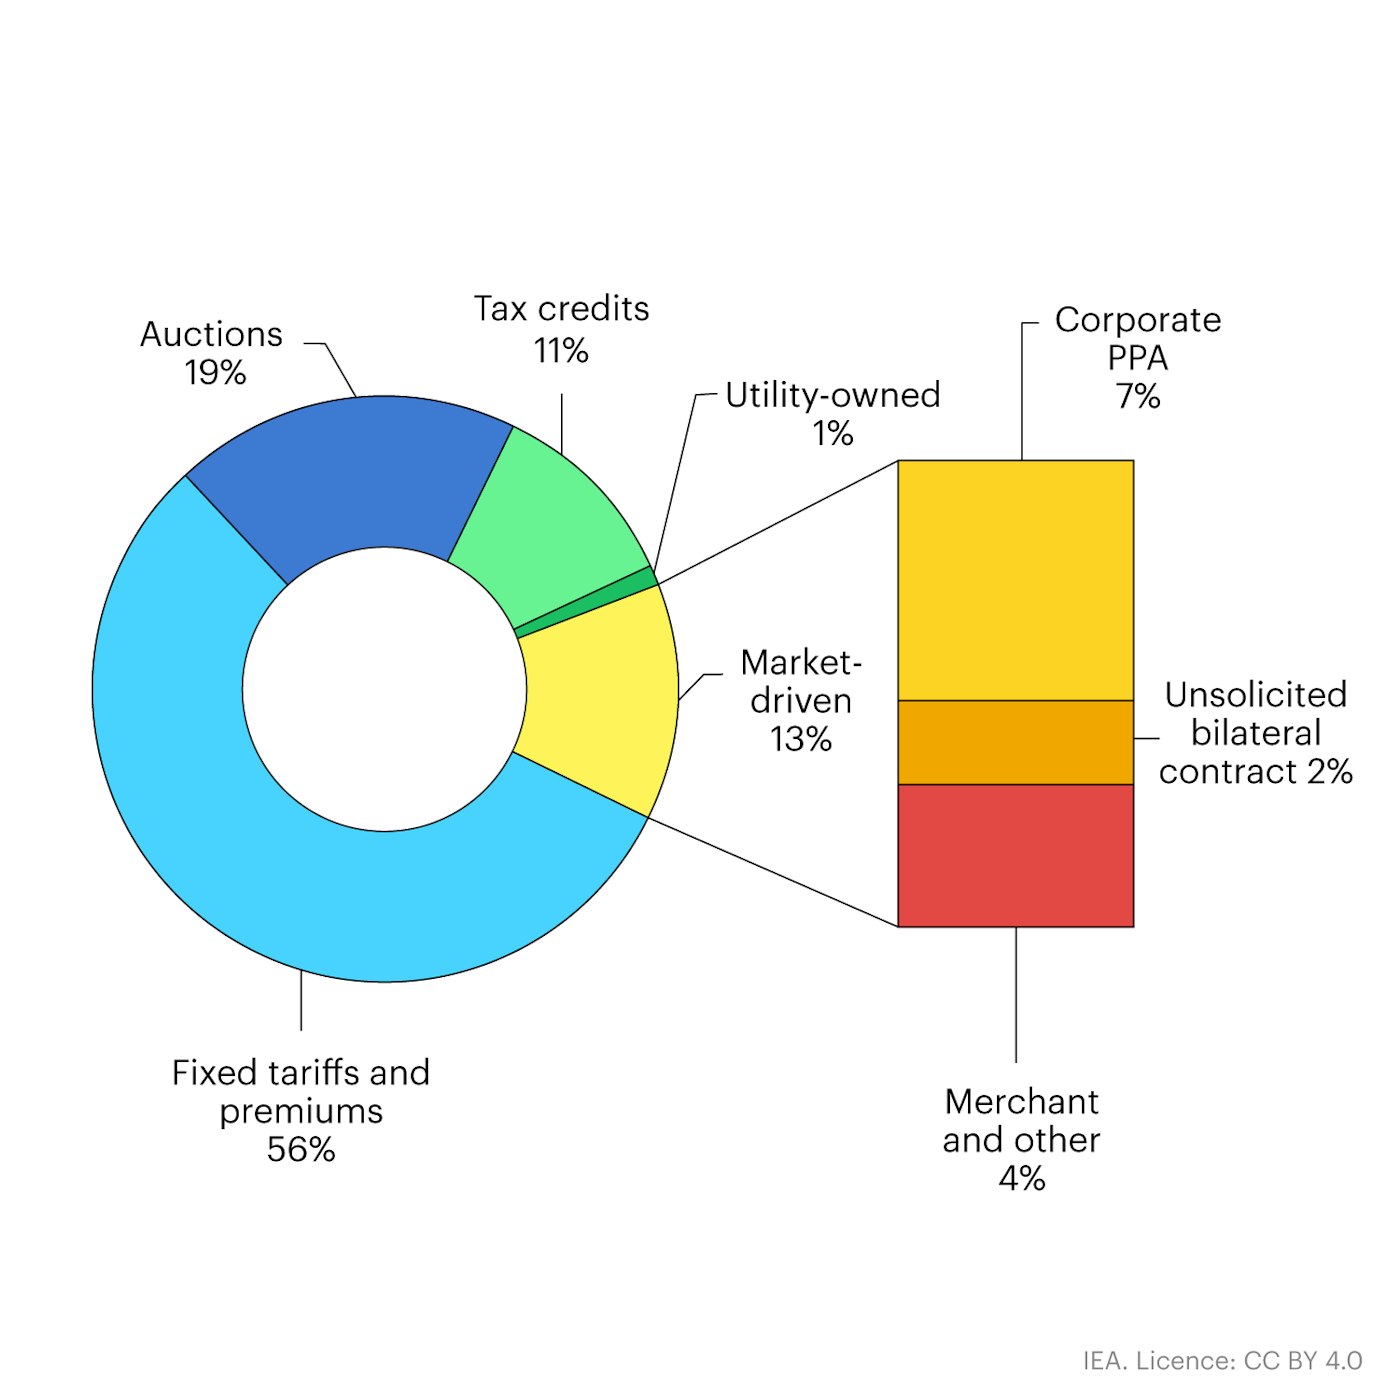
These challenges fall into four main categories. First are policy uncertainties and delayed policy responses to the new macroeconomic environment, encompassing inflexible auction design. During the energy crisis, governments intervened in energy markets to protect consumers from high prices. While these interventions were justified, they also created uncertainty for investors over the future investment environment in the electricity sector. The macroeconomic changes also drove up costs and contract prices for wind and solar PV projects, and a lack of reference price adjustments and contract price indexation methodologies reduced the bankability of projects, mostly in advanced economies.
Meanwhile, emerging economies have been slow to develop strong renewable energy targets and clear incentive schemes. While renewable energy projects (especially solar PV and wind) are already more affordable than fossil fuel-based alternatives, slower-than-expected demand growth has resulted in overcapacity of young coal and gas fleets in many emerging economies, creating little need for additional capacity.
The second problem is insufficient investment in grid infrastructure, which has been preventing faster expansion. Today, more than 3 000 GW of renewable generation capacity are in grid queues, and half of these projects are in advanced stages of development.1 This challenge holds true for both advanced economies and emerging and developing countries. Development lead times for grid infrastructure improvements are significantly longer than for wind and solar PV projects.
The third challenge involves permitting. The amount of time required to obtain permits can range from one to five years for ground-mounted solar PV projects, two to nine years for onshore wind, and nine years on average for offshore wind projects. Delays resulting from complex and lengthy authorisation procedures are slowing project pipeline growth, limiting participation in renewable energy auctions, raising project risks and costs, and ultimately weakening project economics.
The fourth obstacle is insufficient financing in developing countries. Mitigating risks in high-risk countries through concessional financing continues to be challenging because of ongoing policy uncertainties and implementation challenges, for instance in Kenya, South Africa, and Nigeria. In many developing countries, government-owned utilities are under financial stress and the weighted average cost of capital (WACC) can be two to three times higher than in mature renewable energy markets, reducing project bankability. Every percentage point decline in the WACC reduces wind and solar PV generation costs by at least 8%.
Renewable capacity growth by technology, main and accelerated cases, 2005-2028
OpenGovernments have multiple options to address these challenges in the short term to unlock 21% more renewable capacity in the accelerated case, with almost 4 500 GW becoming operational in the next five years. In our accelerated case forecast, governments can achieve important policy improvements by:
- Simplifying permitting procedures and/or setting clear permitting timelines; identifying preferential areas for renewable energy projects to fast-track permitting; and removing certain permitting requirements for small renewable power projects or increasing the minimum capacity requirement for environmental impact assessments without compromising strong sustainability measures.
- Considering that new grid infrastructure often takes five to 15 years to plan, compared with one to five years for new renewable energy projects; aligning and integrating planning and execution of transmission and distribution grid projects with broad long-term energy planning processes, and ensuring that regulatory risk assessments allow for anticipatory investments.
- Standardising power purchase contracts and backing them up with government guarantees, especially for publicly owned utilities, to reduce financial risks for off-takers.
- Adapting auction designs to the new macroeconomic environment by indexing contract prices to various macroeconomic indicators specific to each renewable technology, such as relevant commodity prices, inflation and interest rates for different stages of project development.
- Implementing policies and regulatory reforms to de-risk renewable energy investments and reducing the cost of financing, especially in emerging and developing economies (EMDEs).
In our accelerated case, onshore wind and utility-scale solar PV together have the largest upside potential. Simplifying permitting and adapting auction designs would lead to higher auction subscriptions, and thus faster deployment of utility-scale solar PV and wind power plants, as would higher investment in transmission and distribution grids.
For distributed solar PV, although we have already revised our forecast upwards to reflect policy improvements and higher retail prices for electricity, the pace of consumer adoption is always a forecast uncertainty, especially in a high-interest-rate environment. Our accelerated case therefore assumes faster adoption of residential and commercial solar PV thanks to the prolongation of high retail electricity prices and government support for low-cost financing.
Renewables overtake coal in early 2025 to become the largest energy source for electricity generation globally
By 2028, potential renewable electricity generation is expected to reach 14 430 TWh, an increase of almost 70% from 2022. Over the next five years, several renewable energy milestones could be achieved:
- In 2024, variable renewable generation surpasses hydropower.
- In 2025, renewables surpass coal-fired electricity generation.
- In 2025, wind surpasses nuclear electricity generation.
- In 2026, solar PV surpasses nuclear electricity generation.
- In 2028, solar PV surpasses wind electricity generation.
Share of renewable electricity generation by technology, 2000-2028
OpenOver the forecast period, potential renewable electricity generation growth exceeds global demand growth, indicating a slow decline in coal-based generation while natural gas remains stable. In 2028, renewable energy sources account for 42% of global electricity generation, with the wind and solar PV share making up 25%. In 2028, hydropower remains the largest renewable electricity source. However, renewable electricity generation needs to expand more quickly in many countries (see Net Zero Tracking section).
While renewables are currently the largest energy source for electricity generation in 57 countries, mostly thanks to hydropower, these countries represent just 14% of global power demand. By 2028, 68 countries will have renewables as their main power generation source but still only account for 17% of global demand.
Net Zero Emissions by 2050 Scenario tracking
The tripling goal is within reach, but more effort is needed
Prior to the COP28 climate change conference in Dubai, the International Energy Agency urged governments to support five pillars for action by 2030, among them the goal of tripling global renewable power capacity. Several of the IEA priorities were reflected in the Global Stocktake text agreed by the 198 governments at COP28, including the tripling renewables goal. Tripling global renewable capacity from 2022 levels by 2030 would take it to 11 000 GW, in line with the IEA Net Zero Emissions by 2050 Scenario. Under existing policies and market conditions, global renewable capacity is forecast to reach 7 300 GW by 2028 in our main case. Although this growth means that renewables account for almost all newly added power capacity worldwide, its trajectory would see global capacity increase to two and a half times its current level by 2030, falling short of the tripling goal. In our accelerated case forecast, global cumulative capacity more than doubles to reach over 8 130 GW by 2028, putting the world nearly on track to meet the global tripling pledge.
Cumulative renewable electricity capacity in the main and accelerated cases and Net Zero Scenario
OpenIn 2023, G20 countries collectively accounted for almost 90% of global cumulative renewable power capacity. In September 2023, G20 leaders declared their willingness to “…pursue and encourage efforts to triple renewable energy capacity globally through existing targets and policies, […], in line with national circumstances by 2030”. Accordingly, they have the potential to significantly contribute to a global tripling of renewables, through full and faster implementation of existing policies and targets. However, stronger policy efforts are needed in many other countries. Renewable energy expansion in 2023 was heavily concentrated in just ten countries, responsible for 80% of global annual additions. To achieve a tripling of global renewable capacity, a much faster deployment rate is necessary in numerous other nations. Moreover, many emerging and developing economies rely primarily on hydropower. This implies that solar PV and wind must grow significantly more than threefold by 2030 to meet the global tripling goal. Achieving this will demand new policies tailored to the unique circumstances and requirements of emerging and developing nations.
Relative to our accelerated case projections for renewable capacity in 2028, reaching the tripling of renewables by 2030 would necessitate the commissioning of almost 3 000 GW of new renewable capacity in 2029 and 2030. Average annual renewable capacity additions in 2029-2030 would therefore have to be 165% higher than in 2027-2028, the last two years of our accelerated case forecast.
Gaps also vary significantly by technology. For solar PV, additions need to increase just 35% in 2029 and 2030 while for wind they would need to double. For hydropower and other renewables, annual additions need to triple compared with 2027 and 2028.
References
Connection queue data based on publicly available information from the United States, Brazil, Colombia, Spain, France, Italy, the United Kingdom, India, Japan, Chile, Germany, Australia and Mexico.
Reference 1
Connection queue data based on publicly available information from the United States, Brazil, Colombia, Spain, France, Italy, the United Kingdom, India, Japan, Chile, Germany, Australia and Mexico.