Cite report
IEA (2023), Renewable Energy Market Update - June 2023, IEA, Paris https://www.iea.org/reports/renewable-energy-market-update-june-2023, Licence: CC BY 4.0
Report options
Are market forces overtaking policy measures as the driving force behind wind and solar PV?
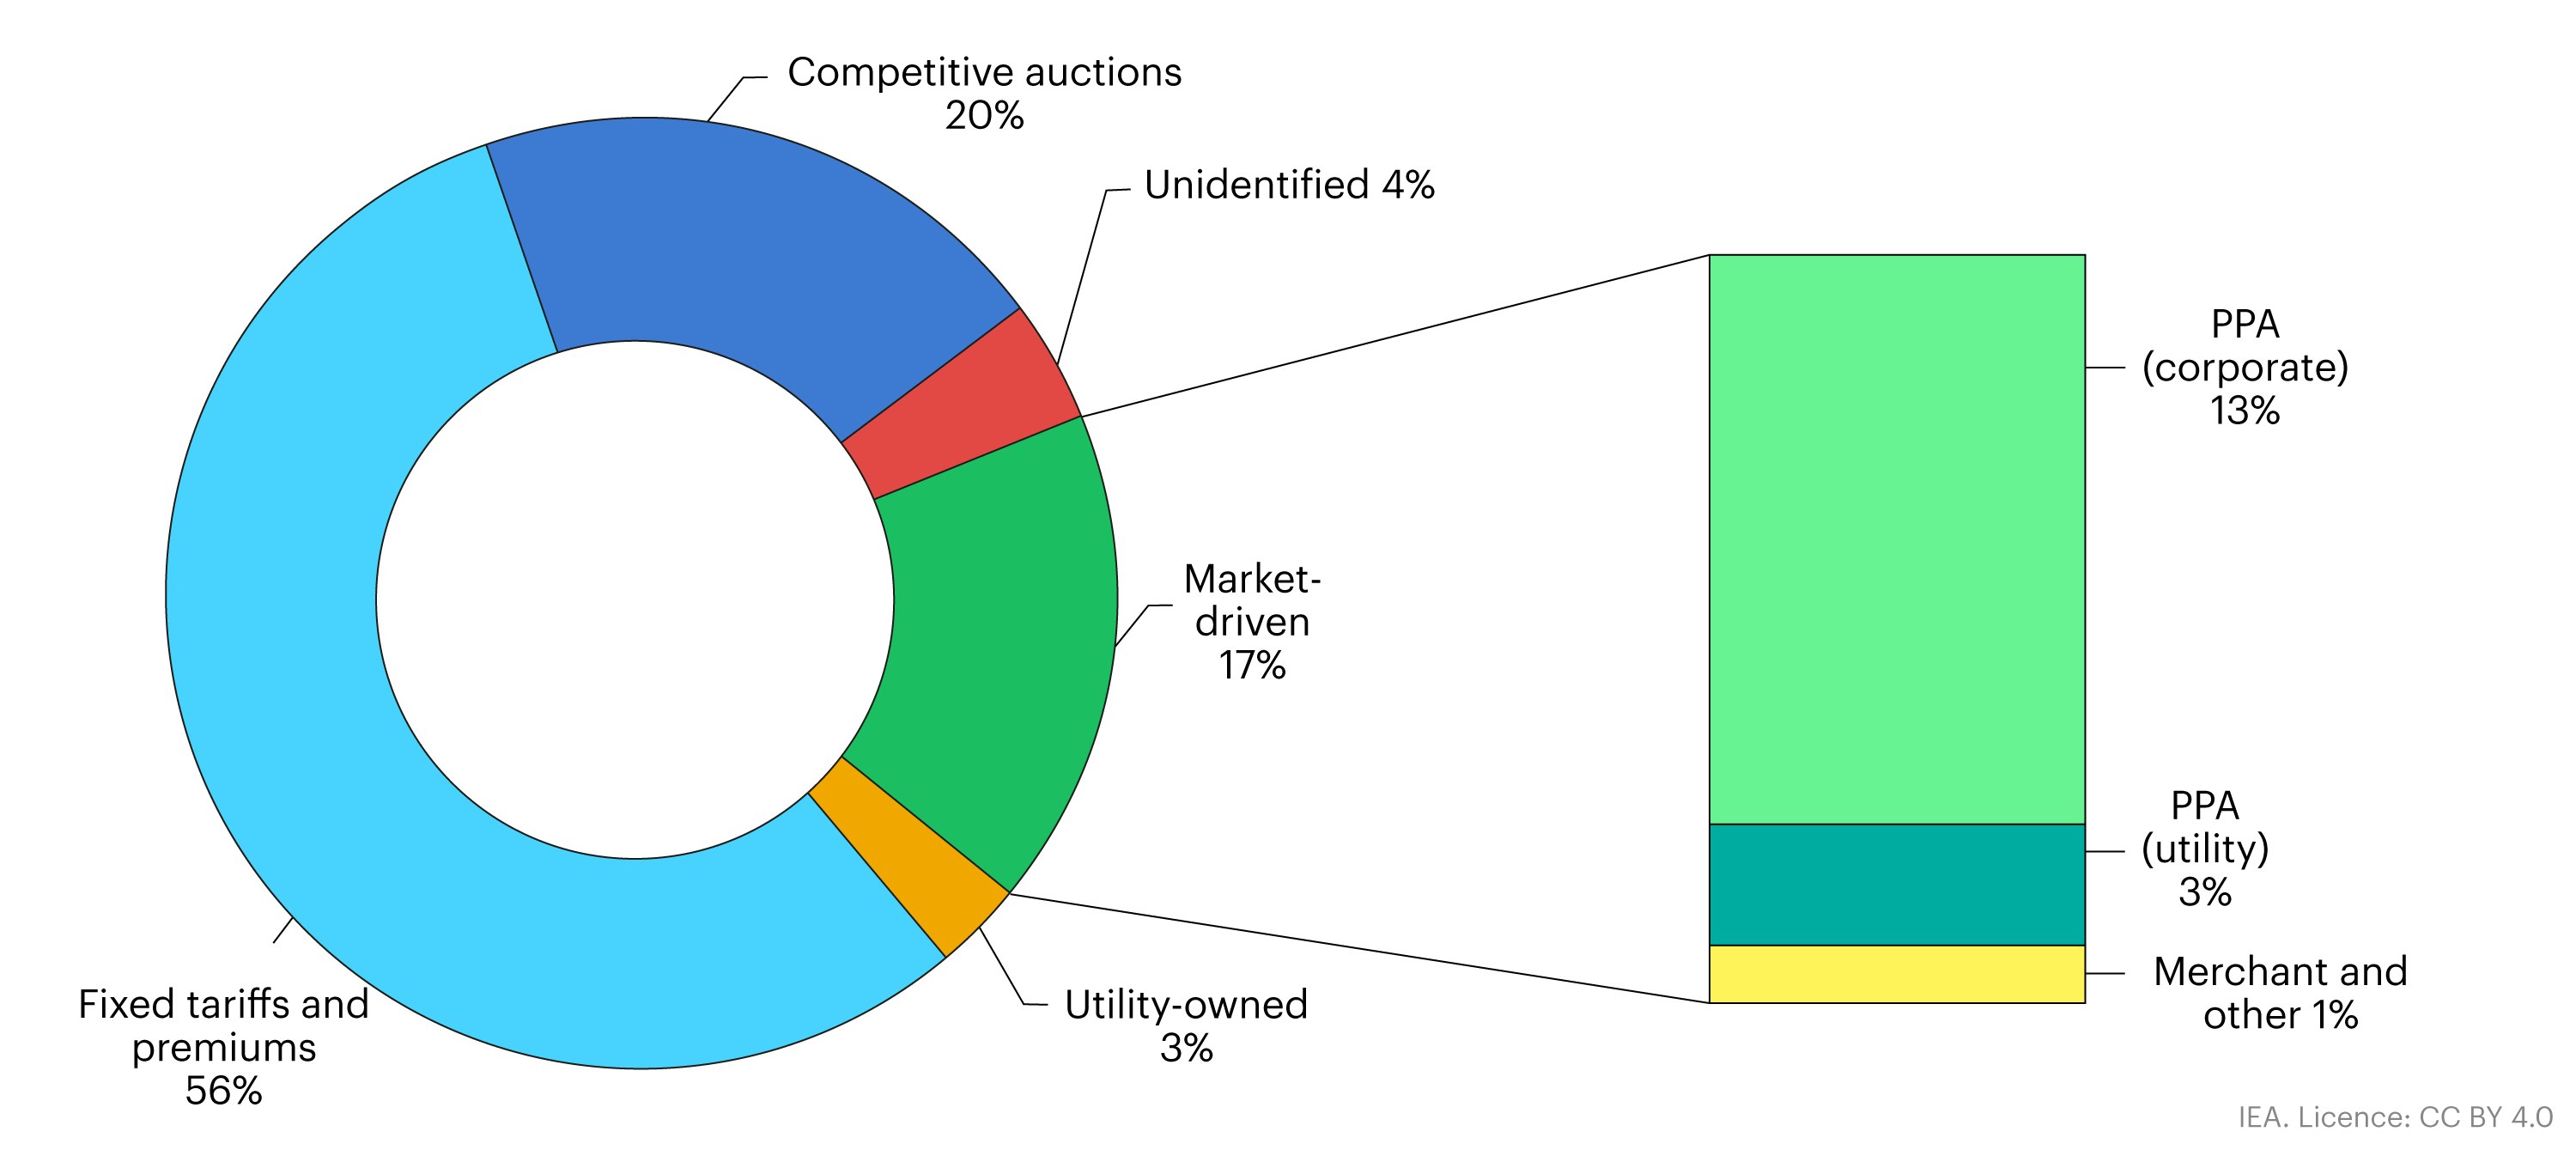
Market-driven procurement is expected to account for one-fifth of utility solar PV and wind capacity expansion between 2023 and 2024, and almost twice as much (36%) when China is excluded. Market-driven procurement is a business model that allows for renewable power price discovery between buyers and sellers. Modes include bilateral contracts (PPAs) between IPPs and corporate consumers or utilities; merchant projects; and remuneration from certificate schemes.
Conversely, policy-driven procurement refers to models in which government decisions affect the price signal for investment. It can take the form of policy support, such as the setting of volumes or controlling of prices, or regulatory measures, which directly affect competition. The two most prominent policies have been administratively set tariffs for remuneration (wherein the government decides on a fixed tariff to offer developers) and competitive auctions (wherein the government puts a set amount of capacity up for bid and sets a limit on what it will pay for the power). Utility-owned projects in regulated markets constitute a third policy-based procurement method, as the price signal is effectively absent by default of the regulatory environment.
Share of Solar PV and wind forecast by primary procurement type, 2023-2024
Open
Solar PV and wind forecast by primary procurement type, 2023-2024
OpenGlobally, almost 60% of utility-scale solar PV and wind deployment in the next two years will be developed under policies with administratively set remuneration policies such as fixed tariffs, premiums, and utility-owned projects. However, most of this deployment will be in China, where developers receive tariffs set at the provincial benchmark electricity price now that renewable energy feed-in tariffs have been phased out. Excluding China, less than 15% of the world’s utility-scale solar PV and wind capacity additions are expected to be procured through administratively set tariffs.
The largest growth is in the United States, from utility-owned projects in regulated markets, followed by the Asia Pacific region, from feed-in tariffs in Japan, Chinese Taipei and Viet Nam. In Europe, growth in administratively set procurement is mostly in onshore wind in France, where a feed-in premium exists for small projects, and from feed-in tariffs in the Republic of Türkiye (hereafter “Türkiye”).
Competitive auctions are the largest source of policy-driven growth outside of China, accounting for almost half, led by Europe and followed by India, the United States, Korea, the United Arab Emirates and Brazil. The main motivations for auction-based growth are policy actions to meet climate goals (in the European Union), utility choice (in the United States) and economic attractiveness (in the Middle East and North Africa).
Market-driven growth, which accounts for 17% of the world’s utility solar and wind expansion, is dominated mostly by corporate PPAs. The United States leads expansion in corporate PPAs, followed by Brazil, Australia, Spain and Sweden, all motivated by the economic attractiveness of these technologies, the opportunity to hedge against rising and volatile power prices, and sustainability goals. Unsolicited bilateral contracts with utilities (PPAs with utility offtake) are prominent mostly in regulated markets, while some growth is expected from merchant projects in Chile, the United States, Denmark and Spain.
Outside of China, Europe leads most of the policy-driven renewable capacity expansion, while market-driven growth remains very important in the United States and North America in general. How each of these markets evolves over the next two years will depend on the wholesale electricity price environment and on regulatory and policy decisions.
Economic attractivness and consumer demand drive PPA growth in the United States
Over half of US utility-scale solar and wind growth is expected to come from bilateral contracts for either corporate or utility offtake, spurred by both economic attractiveness and corporate demand to meet sustainability goals. Corporate PPAs are forecast to account for the largest share (40%), mostly in the form of virtual PPAs1 in deregulated wholesale markets. Over 80% of the virtual PPAs signed between 2021-2023 were in the ERCOT, MISO and PJM service areas.
However, rising PPA prices do pose a downside risk. Climbing interest rates, equipment price increases and interconnection queues have driven up costs for developers, while supply chain delays slowed supply amid rising demand. As a result, CPPA prices rose an estimated 11% in the ERCOT, PJM and MISO service areas between Q4 2022 and Q1 2023.
Nonetheless, consumer demand for virtual PPAs is expected to remain strong, in part because of the cost savings they can offer consumers by aggregating demand across multiple locations. For developers, the economics of PPAs are expected to remain appealing with the IRA extending the ITC, and with new opportunities for 10% premiums for projects being developed in energy communities starting in 2023. Additional revenue from renewable energy certificates (RECs) in some markets also strengthens the business case.
The remaining 60% of US renewable capacity expansion over 2023-2024 is mostly from utility-owned plants, competitive auctions, and PPAs with utilities. These are the dominant procurement methods in regulated markets in the Southeastern, Southwestern and Northwestern states, but procurement approaches vary across states depending on the regulatory environment and whether utilities have a choice. The main drivers for growth are consumer demand for renewable power (sometimes in the form of green tariffs), the economic attractiveness of PV and wind systems compared with a utility’s existing fleet, and the need to comply with a government’s renewable energy targets.
Competitive auctions drive European growth in 2023-2024, but the pace will depend on policy responses to volatile wholesale prices and rising costs
The leading procurement method in Europe is competitive auctions, accounting for at least 60%##nchor2## of renewable capacity growth between 2022 and 2024. Almost half of this growth will be from auctions for two-way fixed contracts for difference,3 led by Poland, the United Kingdom, France, Italy, and Spain. Türkiye use one-way fixed-tariff auctions with price indexation, wherein the strike price is the contractual price irrespective of the wholesale market price.
Meanwhile, Germany, the Netherlands, the Czech Republic and Slovenia use a one-way floor that guarantees developers the minimum strike price and an uncapped maximum from the wholesale market.4 In September 2022, the European Union agreed to begin taxing wholesale market revenues of more than 180 EUR/MWh in an attempt to reduce the burden on consumers, with some member states implementing even lower thresholds.
However, uncertainty over future capacity growth in Europe’s auctions is mounting because they have been increasingly undersubscribed due to permitting challenges, and more recently due to the rising costs developers are facing from commodity prices, equipment costs, interest rates and inflation. As a result, developers are wondering whether they should turn to wholesale markets and direct PPAs with corporations and utilities with the prospect of higher remuneration. For instance, auction ceiling prices in Germany at the end of 2022 were just EUR 60/MWh, compared with corporate PPA of almost EUR 100/MWh and wholesale prices over 250 EUR/MWh.
Going forward, unsubsidised projects in the form of PPAs and merchant plants are expected to account for 22% of Europe’s capacity expansion. The majority of this will be corporate PPAs, led by Spain, Sweden, Germany, the Netherlands, and Denmark, with projects emerging in the United Kingdom, Italy, and Poland. While installations being developed on a fully merchant model are likely to constitute a minority, PPA projects are expected to stack revenues by combining a merchant tail.
Nonetheless, the pace of growth for unsubsidised projects in the Europe is also somewhat uncertain. Ambiguity over how long high wholesale prices will persist, especially with the share of marginal-cost PV and wind increasing, poses a downside risk to plants relying solely on merchant revenue. In addition, signed PPA volumes in Europe were down 20% in 2022 compared to 2021, as developers raised contract prices to account for rising costs, while buyers were hesitant to lock in higher tariffs.
The primary factor affecting procurement methods in Europe will be countries’ policy and regulatory responses to the risks developers face. For competitive auctions, some governments have already begun to take action to accelerate growth by adjusting auction designs and contracts to reflect developers’ cost uncertainties. In 2023, Germany raised its auction price ceilings by 90% (to EUR 113/MWh) for onshore wind and by 25% (to EUR 74/MWh) for solar PV. As a result, solar PV auctions were oversubscribed for the first time since 2021. Portugal, meanwhile, will adjust the strike prices of its last three years of projects to account for inflation and rising equipment prices, and France will allow non-operational auctioned projects to sell electricity on the spot market for 18 months prior to the contract start date.
Our forecast also expects corporate PPA growth to resume. PPA prices in March 2023 have fallen around 30% from November 2022, and the European Commission’s draft of electricity market reforms suggests PPAs may play a more prominent role in the future. The March 2023 draft proposes that auctions be changed to two-way contracts and that auction bidders be allowed and encouraged to also enter into bilateral PPAs with other offtakers. While a final proposal will not be approved until 2025, developers may begin to devise business models in anticipation.
References
Virtual PPAs are a financial contract for difference between a wholesale electricity price and the PPA price. As virtual PPAs require access to the wholesale market, the majority of the corporate PPA growth will occur in deregulated markets.
The value represents deployment in Germany, Spain, France, the United Kingdom, Poland, the Netherlands, Sweden, Italy, Denmark, Belgium, and Türkiye, which account for 85% of Europe’s growth. The value would be higher if competitive auctions from the remaining European countries are included.
In this model, developers receive a subsidy from the government when the wholesale price is below the strike price and will pay back any revenues that exceed the strike price.
New regulations to protect consumers have introduced temporary wholesale and gas price caps in multiple European countries.
Reference 1
Virtual PPAs are a financial contract for difference between a wholesale electricity price and the PPA price. As virtual PPAs require access to the wholesale market, the majority of the corporate PPA growth will occur in deregulated markets.
Reference 2
The value represents deployment in Germany, Spain, France, the United Kingdom, Poland, the Netherlands, Sweden, Italy, Denmark, Belgium, and Türkiye, which account for 85% of Europe’s growth. The value would be higher if competitive auctions from the remaining European countries are included.
Reference 3
In this model, developers receive a subsidy from the government when the wholesale price is below the strike price and will pay back any revenues that exceed the strike price.
Reference 4
New regulations to protect consumers have introduced temporary wholesale and gas price caps in multiple European countries.