Cite report
IEA (2020), Global Energy Review 2020, IEA, Paris https://www.iea.org/reports/global-energy-review-2020, Licence: CC BY 4.0
Report options
Global energy and CO2 emissions in 2020
Energy demand
The latest data show that the drastic curtailment of global economic activity and mobility during the first quarter of 2020 pushed down global energy demand by 3.8% relative to the first quarter of 2019. If lockdowns last for many months and recoveries are slow across much of the world, as is increasingly likely, annual energy demand will drop by 6% in 2020, wiping off the last five years of demand growth. Such a decline has not been seen for the past 70 years. If efforts to curb the spread of the virus and restart economies are more successful, the decline in energy demand could be limited to under 4%. However a bumpier restart, disruption to global supply chains, and a second wave of infections in the second part of the year could curtail growth even further.
Rate of change of global primary energy demand, 1900-2020
OpenFirst quarter of 2020 - compared with first quarter of 2019
Global energy demand in the first quarter of 2020 (Q1 2020) declined by 3.8%, or 150 million tonnes of oil equivalent (Mtoe), relative to the first quarter of 2019, reversing all the energy demand growth of 2019. The drop in global economic activity cut demand for some energy sources much more than for others, with impacts on demand in Q1 2020 going well beyond declines in GDP for certain sectors and fuels.
In Q1 2020, restrictions on economic activity, as well as changes in weather, hit global coal demand hardest, pushing it down by almost 8% from Q1 2019. The decline took place mainly in the power sector as a result of significant reductions in electricity demand (-2.5%) and competition from very cheap natural gas. The curtailment of industrial production also had an important impact on coal demand over the first three months of the year, with industrial coal demand declining notably in China.
Global oil demand was down nearly 5%. Restrictions on travel and the closing of workplaces and borders sharply reduced demand for personal vehicle use and air travel, while the curtailment of global economic activity put a brake on fuel oil use for shipping.
Output from the world’s nuclear power plants also declined in Q1 2020 as they adjusted to lower electricity demand levels, particularly in Europe and the United States.
Demand for natural gas declined by around 2% in Q1 2020, with China, Europe and the United States experiencing the most significant declines. The drop in demand in major markets was softened by continued low prices for gas, shifting much of the impact of lower electricity demand onto coal. Gas storage levels rose markedly in Q1 2020 because of increases in year-on-year trade in liquefied natural gas (LNG) combined with lower demand.
Renewable energy demand increased by about 1.5% in Q1 2020, lifted by the additional output of new wind and solar projects that were completed over the past year. In most cases, renewables receive priority in the grid and are not asked to adjust their output to match demand, insulating them from the impacts of lower electricity demand. As a result, the share of renewables in the electricity generation mix rose considerably, with record-high hourly shares of variable renewables in Belgium, Italy, Germany, Hungary and eastern parts of the US.
Not all of the declines in demand in Q1 2020 were a result of the response to Covid‑19. The continuation of milder than average weather conditions throughout most of the Northern Hemisphere winter also pushed down demand. The impact of weather was particularly strong in the United States, where the majority of the 18% decline in residential and commercial gas consumption can be attributed to a milder winter than in 2019.
Differing demand trends for each fuel resulted in significant changes in the global energy mix in Q1 2020. As a result of the drop in global coal demand, the share of coal in the mix declined almost 1 full percentage point to below 23%. There was little change in the share of oil and natural gas, however. Renewables experienced the largest increase, with their share jumping to almost 13%, over half a percentage point above Q1 2019. The change in the power sector mix was even more marked, with renewables increasing their share from 26% in Q1 2019 to 27.5% in Q1 2020.
Regional impacts on Q1 2020 energy demand depended on when lockdowns were implemented and how lockdowns affected demand in each country. Drawing on real-time energy demand, mobility and lockdown stringency data, the IEA has assessed the impact of lockdowns and other restriction measures on weekly energy demand compared with corresponding weeks in 2019.
Less stringent restrictions in Korea and Japan have limited the impact on demand to below 10% on average. In China, where Covid‑19 lockdowns were first implemented, not all provinces experienced restrictions of the same stringency. Nonetheless, the virus containment measures resulted in weekly energy demand across China falling by around 15%. Lockdowns in Europe were more gradual, going from partial to full lockdown. Periods of partial lock down cut weekly demand by 17% on average. Countries with higher share of services in the economy and the greater stringency of lockdowns resulted in weather corrected demand reductions averaging close to 25%, reaching above 30% in some cases. India’s full national lockdown has reduced energy demand by almost 30%, meaning that with each additional week of lockdown, annual energy demand is reduced by 0.6%. Overall we estimate that an additional month of the restrictions in place as of early April would reduce global annual energy demand by around 1.5%.
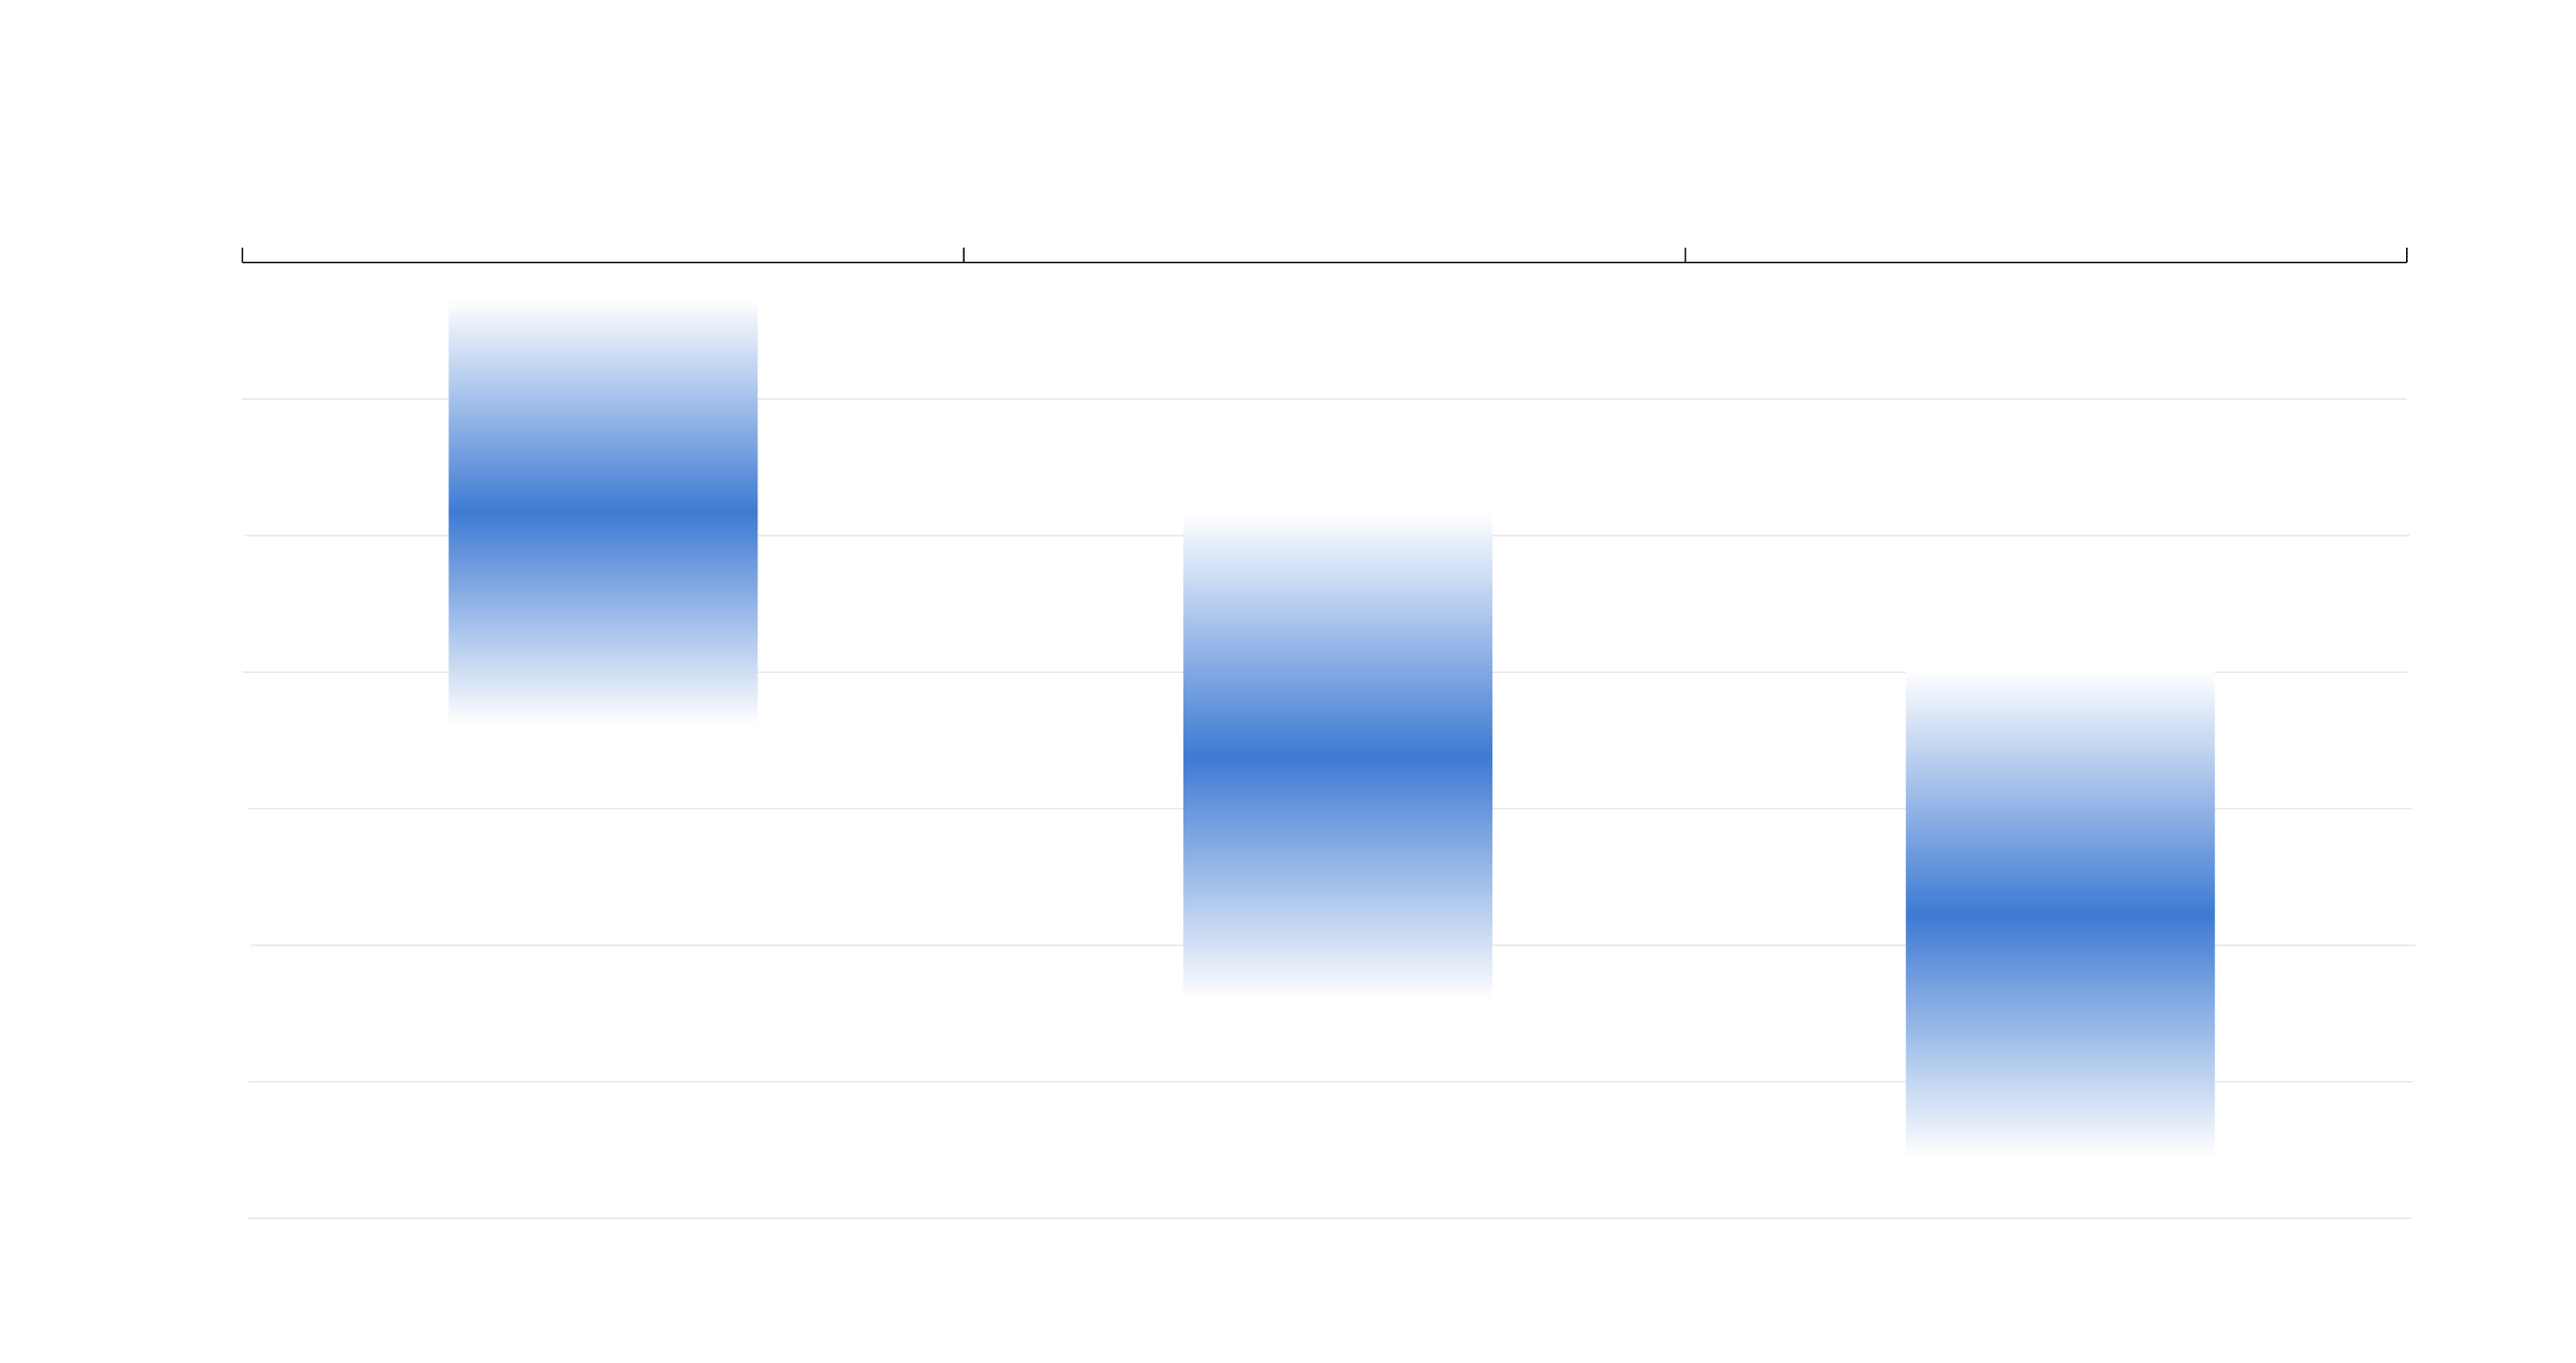
Reduction in weekly energy demand during periods of lockdown and overall demand change, Q1 2020
Weekly reduction
Full lockdown
Limited restrictions
Partial lockdown
0%
-5%
-10%
-15%
-20%
-25%
-30%
-35%
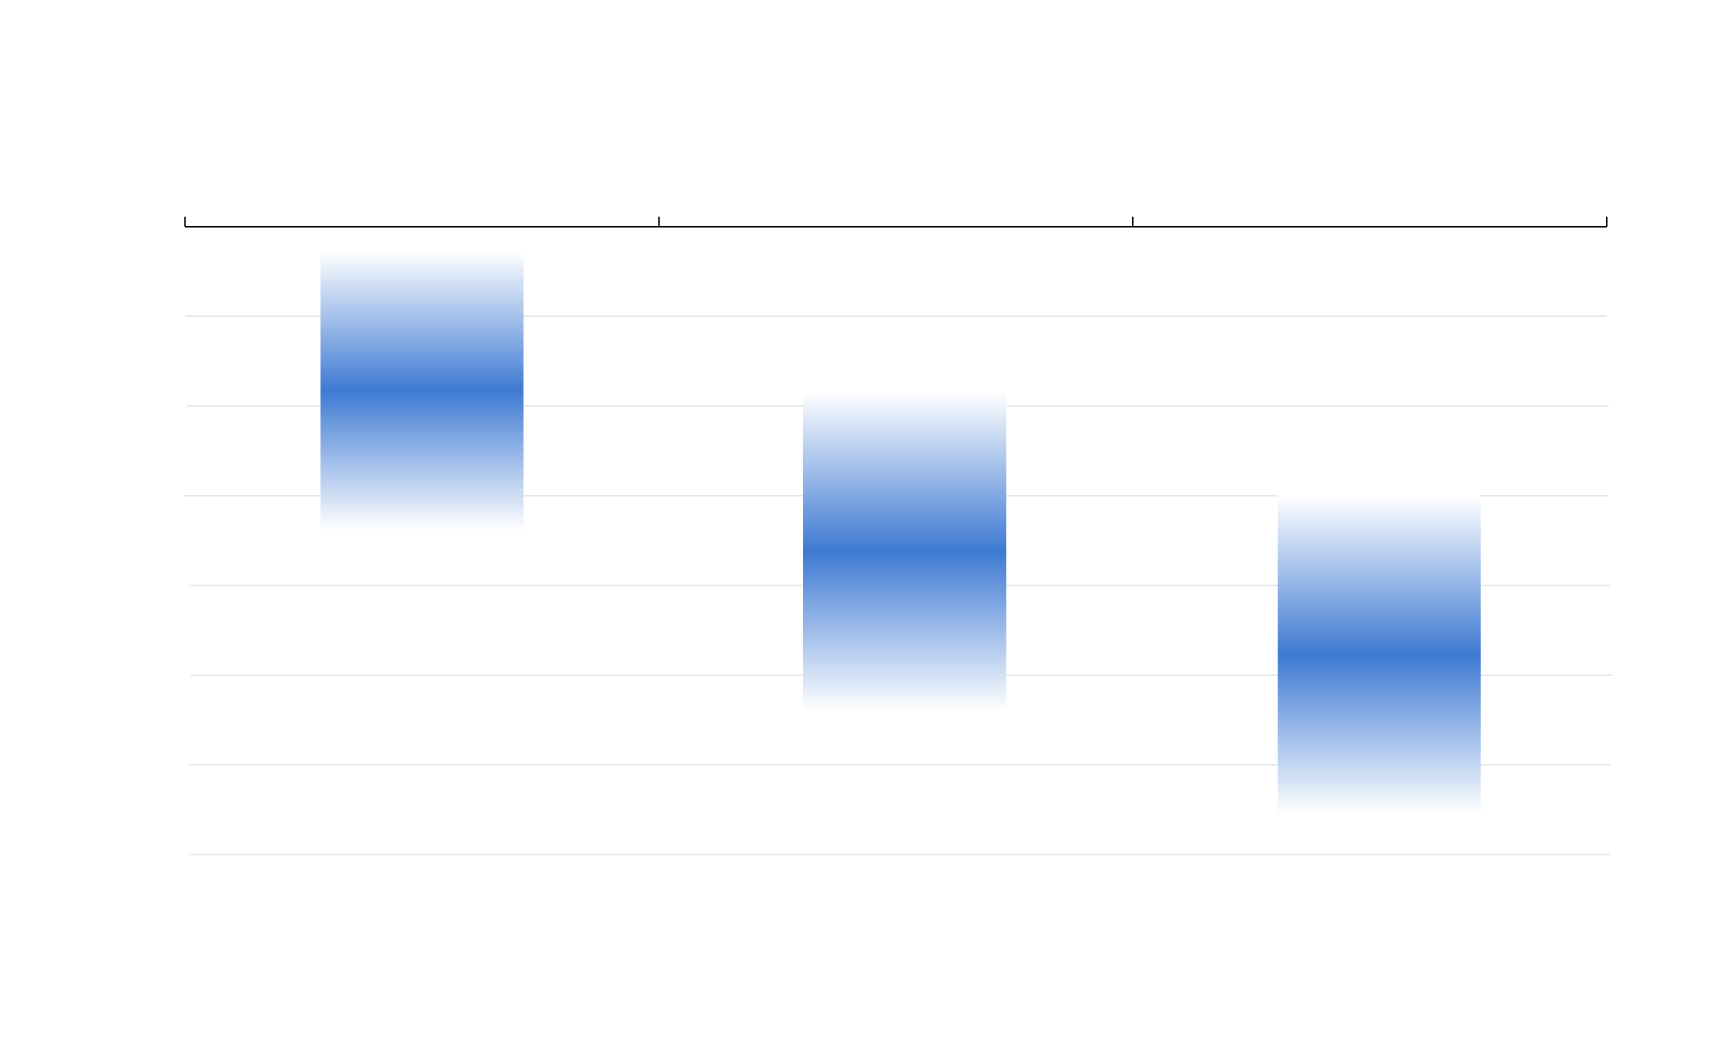
Reduction in weekly energy demand during periods of lockdown and overall demand change, Q1 2020
Weekly
reduction
Limited restrictions
Partial lockdown
Full lockdown
0%
-5%
-10%
-15%
-20%
-25%
-30%
-35%
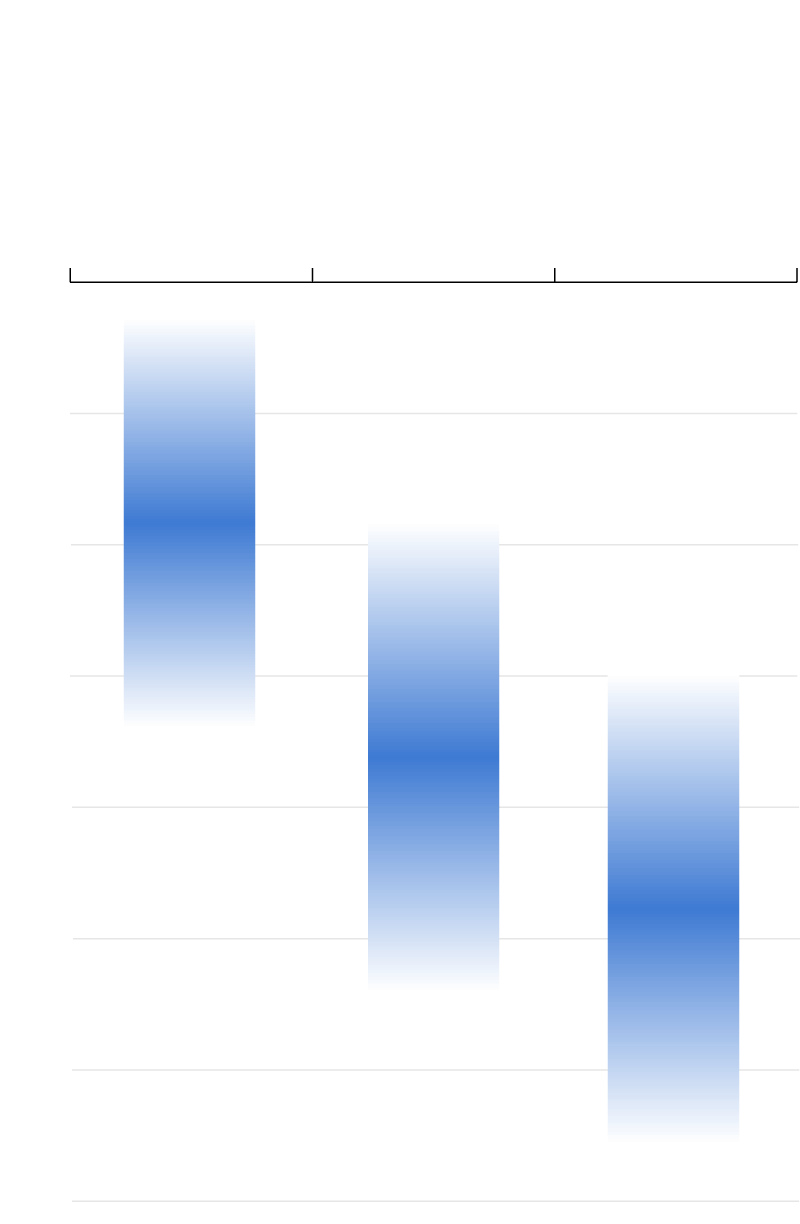
Reduction in weekly energy demand during periods of
lockdown and overall demand change, Q1 2020
Weekly
reduction
Limited
restrictions
Partial
lockdown
Full
lockdown
0%
-5%
-10%
-15%
-20%
-25%
-30%
-35%
China faced the Covid‑19 crisis earlier than other regions, with around eight weeks of lockdown during Q1 2020, more than any other region. As a result, China had the most significant drop in total energy demand, which fell by over 7% compared with Q1 2019.
Across the United States, energy demand fell by 6% compared with Q1 2019. While the response to Covid‑19 impacted demand in March, much of the fall in quarterly demand can be attributed to milder weather.
Energy demand in the European Union declined by over 5% relative to Q1 2019. The decline in activity and energy demand was concentrated in March after lockdowns were implemented. Demand fell most in regions that implemented lockdowns earlier, imposed more stringent lockdowns, and where tourism represents a significant part of the economy.
The impact on Q1 2020 energy demand in India was modest, with demand increasing by 0.3 relative to Q1 2019. The major impact of India’s lockdown on weekly energy demand was only felt after the country moved into lockdown towards the end of March. As the lockdown continues, the impacts on energy demand are set to be notably larger Q2 2020.
Full-year projections
The evolution of energy demand through the remainder of 2020 will depend most notably on the duration, stringency and geographical spread of lockdowns, and the speed of recoveries. Initial IEA evaluations indicate that full-year energy demand could decline by around 6%, equivalent to the combined energy demand of France, Germany, Italy and the United Kingdom in 2019. The projected 6% decline would be more than seven times the impact of the 2008 financial crisis on global energy demand, reversing the growth of global energy demand over the last five years. The absolute decline in global energy demand in 2020 is without precedent, and relative declines of this order are without precedent for the last 70 years.
Projected change in primary energy demand by fuel in 2020 relative to 2019
OpenAll fuels except renewables are set to experience their greatest contractions in demand for decades. In some cases, annual declines will be stronger than those in the first quarter.
- Oil demand could drop by 9%, or 9 mb/d on average across the year, returning oil consumption to 2012 levels.
- Coal demand could decline by 8%, in large part due to a fall in electricity demand of nearly 5% over the course of the year, pushing down output from coal-fired generators by more than 10%. The recovery of coal demand for industry and electricity generation in China limits the global decline in coal demand.
- Gas demand across the full year could fall much further than in Q1 2020, because of reduced demand in power and industry applications.
- Nuclear power demand would also fall in response to lower electricity demand.
- Renewables demand is expected to increase because of low operating costs and preferential access to many power systems. Recent growth in capacity, with some new projects coming online in 2020, will also boost output. Biofuels however, are likely to see demand decline, directly impacted by lower transport activity.
Energy demand is set to decline in all major regions in 2020. Demand in China is projected to decline by more than 4%, a reversal from average annual demand growth of nearly 3% between 2010 and 2019. In India, energy demand would decline for the first time, following on from low demand growth in 2019. However, it is advanced economies that will experience the greatest declines in energy demand in 2020. In both the European Union and the United States, demand in 2020 is likely to fall around 10% below 2019 levels, almost double the impact of the global financial crisis.
Energy demand growth by region in 2019 and 2020
OpenIf lockdowns are shorter and the global recovery is more rapid, the decline in global energy demand across 2020 could be limited to 3.8% (which is still four times the decline during the global financial crisis). Shorter lockdowns and a more rapid recovery would limit the decline in full-year oil demand to around 6% – with Q2-Q4 averaging a greater decline than in Q1 –and halve the impact on full year energy demand for coal, gas and nuclear, signalling a recovery of demand inQ2-Q4.
On the other hand, a possible second wave of the pandemic or a slower recovery could exacerbate the potential declines by fuel in 2020. Renewables are the only energy source likely to experience demand growth across the remainder of 2020, regardless of the length of lockdown or strength of recovery.
CO2 emissions
The stunning declines in energy demand in Q1 2020 resulted in a major drop in global CO2 emissions, surpassing any previous declines. Not only are annual emissions in 2020 set to decline at an unprecedented rate, the decline is set to be almost twice as large as all previous declines since the end of World War II combined.
First quarter of 2020 - compared with first quarter of 2019
Global CO2 emissions were over 5% lower in Q1 2020 than in Q1 2019, mainly due to a 8% decline in emissions from coal, 4.5% from oil and 2.3% from natural gas. CO2 emissions fell more than energy demand, as the most carbon-intensive fuels experienced the largest declines in demand during Q1 2020.
CO2 emissions declined the most in the regions that suffered the earliest and largest impacts of COVID-19; China (-8%), the European Union (-8%) and the United States (-9%), with milder weather conditions also making an important contribution to the emissions decline in the United States.
Full-year projections
Global CO2 emissions are expected to decline even more rapidly across the remaining nine months of the year, to reach 30.6 Gt for the 2020, almost 8% lower than in 2019. This would be the lowest level since 2010. Such a reduction would be the largest ever, six times larger than the previous record reduction of 0.4 Gt in 2009 due to the financial crisis and twice as large as the combined total of all previous reductions since the end of World War II.
Global energy-related CO2 emissions, 1900-2020
OpenAnnual change in global energy-related CO2 emissions, 1900-2020
OpenOf the almost 2.6 Gt reduction in CO2 emissions, reduced coal use would contribute over 1.1 Gt, followed by oil (1 Gt) and gas (0.4 Gt). The United States would undergo the largest absolute declines at around 600 Mt, with China and the European Union not far behind.